Understanding
trading volume is crucial for traders when buying or selling crypto
assets. This indicator serves as a vital tool for estimating value and,
later on, making a profit. In this article, we will explain in more
detail why trading volume matters and what factors influence it.
What Is A Trading Volume?
Trading volume is the total number of purchases and sales of a
particular crypto coin over a certain period, usually 24 hours. For
example, if the daily trading volume of Solana reaches 4 billion,
traders exchange 4 billion SOLs within a single day. It shows how
popular a project is and whether you should invest in it.
Trading volume matters because it reflects public interest and
determines the potential direction of the coin. It provides insight into
the activity of a specific asset or the market as a whole.
For example, a high trading volume in crypto indicates a large number
of buyers and sellers, making an asset more liquid. This means that
users can easily trade coins without significant price fluctuations. As a
rule, a trading volume tends to rise with the price of the asset. For
example, at the end of July 2021, the value of Ethereum
reached $2,300, with trading volume hitting $6.8 billion. Thus, the
high level of trading volume contributes to the growth of the value of
cryptocurrency and signals about the “health” of a coin.
In contrast, low crypto trading volume means that investors may lack
interest in the asset. It also suggests low liquidity, which makes
transactions difficult and leads to higher volatility. In many cases, a
DeFi project with a small trading volume is a red flag, as the coin may
be “dead” despite a high nominal market cap, as was the case with CUDOS.
In some instances, exchanges even delist assets due to insufficient
trading volume.
Factors That Impact Trading Volume
The crypto market is highly volatile and similar to a living organism
that reacts acutely to external events. Let’s examine in detail the
factors that affect the trading volume:
Market trends: bull and bear tendencies. During bull market
periods, prices rise, and investors actively buy coins, which increases
trading volume due to the massive influx of new participants.
On the other hand, a bear market is when prices are falling due to
panic selling of assets. Here, trading volume can also rise due to an
increased number of sell orders. However, during prolonged bear phases,
the volume gradually decreases as interest in trading drops, as with
Aragon (ANT). During its growth, the trading volume increased and there
was a sharp fall in September.
News and events: one of the most powerful drivers
of trading volume. They have vastly different outcomes. So, positive
news that can increase trading volume includes listings on major
exchanges, project upgrades (like Ethereum 2.0), and the adoption of
cryptocurrencies at a government level. One more example is dogwifhat, a
meme token whose appearance on DEX platforms in 2023 led to an increase
in trading volume and interest among the crypto community.
Negative news that can reduce trading volume include hacker attacks, sanctions and tightening of crypto laws, and scandals.
Liquidity: it means users quickly trade assets without significant price changes. DeFi projects with high liquidity (such as Bitcoin
and Ethereum) tend to have large trading volumes because they are easy
to buy and sell. On the other hand, rare or lesser-known tokens, such as
Shiden Network (SDN) or Umee (UMEE), often have low trading volumes due
to their limited accessibility and are harder to sell. In such markets,
transactions can cause significant price fluctuations, making them less
attractive to traders.
Thus, news, market trends, and liquidity are interrelated factors
that affect trading volume. News creates interest, trends increase
trading activity, and liquidity determines how easily trades can be
executed. Together, they set the direction of the market.
What To Consider While Analyzing Trading Volume?
Analyzing trading volume in cryptocurrencies requires consideration
of factors that help understand how relevant the volume data is and what
conclusions can be drawn.
Firstly, trading volume on the market depends on the chosen time frame.
For example, daily volume helps identify short-term trends, while
weekly or monthly volume reflects more stable long-term patterns. In the
analysis, it is important to take into account not only time intervals
but also the peculiarities of market hours and trader behavior, as the
activity may spike on certain days of the week or during major news
events.
Secondly, trading volume is often influenced by large investors, the so-called crypto whales.
Their actions can significantly distort the real state of the market as
they make one-time large transactions. Such transfers, in turn, can
temporarily inflate volume without indicating stable, ongoing activity.
Therefore, it is essential to use analytical platforms to track large
capital movements, including blockchain data.
Crypto Market Cap Explained: What It Is and Why It Matters
With the crypto market’s surprisingly
rapid evolution, investors constantly seek ways to analyze a coin’s
value, stability, and growth potential. The market cap, or market
capitalization, has become one of the most straightforward metrics for
understanding how cryptocurrencies perform.
With the crypto market’s surprisingly rapid evolution, investors
constantly seek ways to analyze a coin’s value, stability, and growth
potential. The market cap, or market capitalization, has become one of the most straightforward metrics for understanding how cryptocurrencies perform.
You may wonder, but what is a market cap in crypto? Well,
this is what we will discuss today. This article will explore what
market cap means in crypto, how it’s calculated, and why it’s a critical
factor in making smart investment choices.
What Is Market Cap in Crypto?
In basic terms, market cap measures a cryptocurrency’s market value. It is usually calculated
by multiplying a single coin’s current price by its total circulating
supply. Thus, market capitalization indicates how valuable a
cryptocurrency is perceived to be, which helps investors understand its
relative size in the market compared to other coins.
In traditional (or corporate) finance, the market cap applies to the stock market, where it’s calculated by multiplying the share prices of publicly traded companies by the number of shares in circulation.
However, it can adapt to crypto assets’ decentralized and variable
nature, focusing on circulating supply. Thus, a crypto company’s market
cap can show how its native token performs on the market and other
useful metrics such as the average price, the trading volume, etc.
The formula is straightforward: Market Cap = Current Market Price of One Coin x Circulating Supply.
For instance, if EGCOIN (E.G. Coin) has 10 million coins in
circulation, and each coin trades at $10, the market cap would be $100
million.
Market Cap vs. Fully Diluted Market Cap
There’s often confusion between market cap and fully diluted market cap. While the market cap only considers the circulating supply,
the fully diluted market cap projects what a coin’s total value would
be if all coins were in circulation. Simply put, you multiply its price
at a given time by its maximum supply.
For instance, if a cryptocurrency has a limited supply of 100 million
coins but only 10 million are circulating, its market cap will reflect
just those 10 million. However, the fully diluted market cap assumes all 100 million coins are in circulation and calculates the value accordingly.
Why Is Market Cap Important in Crypto?
Anyone interacting with the crypto world must understand the importance of market cap. Why does market cap matter?
Market cap is a value indicator widely used to
analyze a cryptocurrency’s market value and compare it to others in the
market. It’s not a precise measure of a coin’s worth, but it provides a
quick overview of how much the community values it, offering insight
into investor confidence.
It can and does categorize cryptocurrencies: Based on market cap, cryptocurrencies are generally grouped into three categories:
Large-cap cryptocurrencies: Examples
include Bitcoin, Binance Coin, Tether, and Ethereum, which have high
market caps, generally over $10 billion. Large-cap companies (or tokens)
are considered lower-risk investments due to their established
position, higher liquidity, and broader investor interest.
Mid-cap cryptocurrencies: These
coins, like Chainlink, Bitcoin Cash, Litecoin, or Polkadot, are in the
middle range, with market caps between $1 billion and $10 billion. They
often balance growth potential and relative stability, making them
attractive to investors looking for returns beyond large-cap assets
without extreme risk.
Small-cap cryptocurrencies: Coins with market caps
below $1 billion fall into this category. They carry higher risk but
have the potential for significant growth. Small-cap assets attract more
speculative investors willing to take on risk in exchange for higher
growth potential. Some worthy examples include Polygon, Lido, or Brett.
Top Factors Affecting the Crypto Market Cap
Market cap isn’t static. However, it fluctuates based on multiple
factors that impact cryptocurrency prices and the total number of coins
in circulation. But what factors are we talking about?
1. Total Supply
A coin’s supply structure affects its market cap. Cryptocurrencies
with fixed or limited supplies may increase in value as demand grows,
affecting the market cap.
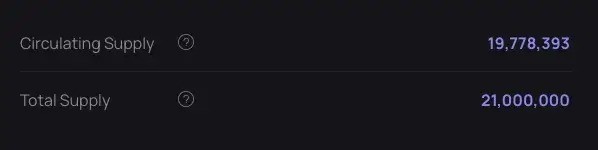
Take Bitcoin, for instance. It has a limited supply of 21,000,000 and
is close to reaching it (with 10,778,393 coins in circulation at the
time of writing). Its limited supply can increase the price, thus also
increasing the market cap. When the max supply is reached, demand will
increase while supply will remain constant, thus increasing scarcity
and, therefore, the crypto’s price.
2. Market Sentiment
Investor sentiment can significantly affect market cap, which often
shifts according to current news and market trends. Positive sentiment
leads to higher prices and can boost market cap, while negative
sentiment has the opposite effect.
Remember the FTX crash? Back in 2022, it affected the entire crypto
market and not only, leaving crypto investors with little to no hope of
recovery for most of their funds. The market cap of every cryptocurrency
was affected by this event, and it was not in a good way.
3. Trading Volume
High trading volume indicates strong market interest and can
stabilize a coin’s price. Low trading volume, on the other hand, can
make a coin more volatile, impacting the market cap as its price
swings.
4. Economic Factors
Like traditional investments, cryptocurrencies are affected by
macroeconomic conditions. Inflation, interest rates, and broader
economic trends can influence the prices of crypto assets and, thus,
their market cap.
After over a decade, recent crypto trading volume statistics have
shown that the market is still expanding. Initially, very few were
familiar with crypto trading, but it has now become commonplace.
A growing number of individuals are investing in cryptocurrency,
aiming for substantial returns. The statistics are mind-blowing, with
surprising trends and everything in between.
Today, it stands as one of the most widely accepted assets. For
instance, in 2024, crypto trading volume statistics have shown new
records and trends. From Bitcoin's steady rise to the surprising jumps
of lesser-known coins, the growth is ever-increasing.
It is important for every crypto trader or enthusiast to have these
statistics at their fingertips. Knowing these statistics gives you an
edge.
Stick around, and find out the crypto trading volume statistics that are shaping the crypto market.
Key Cryptocurrency Trading Volume Statistics
In 2024, the global cryptocurrency market capitalization reached a staggering $2.5 trillion
In 2024, the global daily trading volume for cryptocurrencies averaged over $200 billion
Bitcoin (BTC) remains the undisputed king of crypto, holding roughly 50% of the total market capitalization
Ethereum's trading volume saw a 30% increase year-over-year, reaching $30 billion daily in 2024
Lesser-known altcoins show remarkable trading volume growth, each surpassing $10 billion daily
Total Value Locked (TVL) in DeFi protocols surpassed $200 billion in February 2024
Spot trading volume generally dwarfs derivatives trading volume
East and Southeast Asia remain leading regions in terms of cryptocurrency adoption and trading volume
Global Cryptocurrency Market Capitalization
In 2024, the global cryptocurrency market capitalization reached a
staggering $2.5 trillion. This record high signifies the immense growth
and mainstream adoption of cryptocurrencies, and the overall health and
potential of the crypto market.
Global Crypto Trading Volume in 2024
In 2024, the global daily trading volume for cryptocurrencies
averaged over $200 billion. This marks a significant increase from
previous years, showcasing the growing adoption and liquidity in the
market. For traders, this indicates more opportunities for profitable
trades and a vibrant market ecosystem.
Bitcoin's Dominance
Bitcoin (BTC) remains the undisputed king of crypto, holding roughly
50% of the total market capitalization. This dominance indicates
Bitcoin's stability and influence on the entire market.
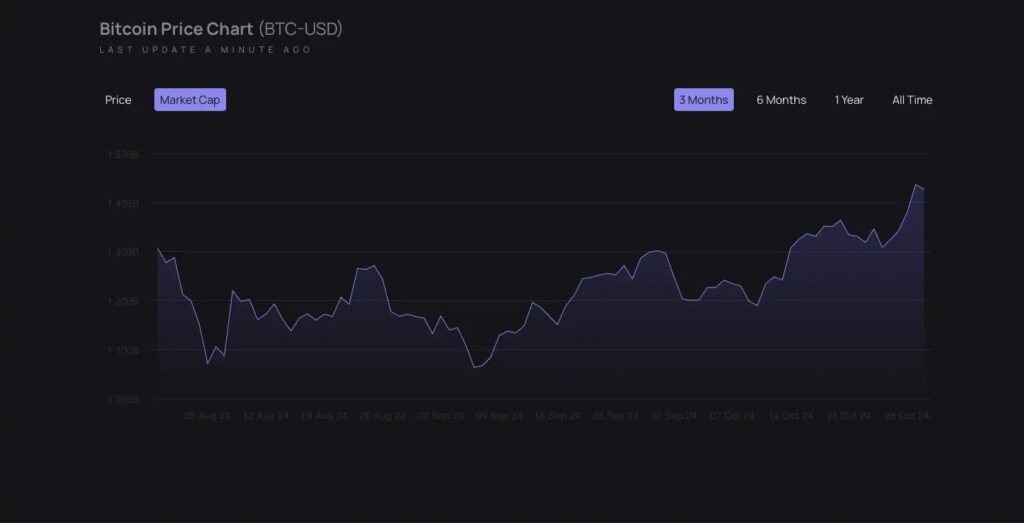
Understanding Bitcoin's price movements and trading volume is
important for all crypto investors, as it often sets the tone for the
broader market.
Rise of Ethereum
Ethereum's trading volume saw a 30% increase year-over-year, reaching
$30 billion daily in 2024. This surge highlights Ethereum's expanding
use cases, particularly in decentralized finance (DeFi) and NFTs, making it an essential coin for those looking to diversify their portfolios.
Emergence of Altcoins
Lesser-known altcoins like Solana and Cardano have shown remarkable
trading volume growth, each surpassing $10 billion daily. These altcoins
are gaining traction due to their unique technological advancements,
offering investors high potential returns and diversification
opportunities.
Rise of Decentralized Finance (DeFi)
DeFi exploded in popularity in 2024 with the Total Value Locked (TVL)
in DeFi protocols surpassing $200 billion in February 2024.
This indicates the growing interest in alternative financial
solutions built on blockchain technology. For traders and enthusiasts,
this could donky mean potential opportunities within DeFi projects and
the potential for high returns.
Spot vs. Derivatives Trading Volume
Spot trading involves buying and selling crypto assets for immediate
ownership, while derivatives trading involves contracts based on the
future value of an asset.
Although data varies by exchange, spot trading volume generally
dwarfs derivatives trading volume. Understanding the split between these
two volumes helps traders gauge investor sentiment and potential market
volatility.
A high derivatives volume might indicate increased speculation and potential for sharp price swings.
Trading Volume by Region
Crypto adoption varies significantly across the globe. East and Southeast Asia remain leading regions in terms of cryptocurrency adoption and trading volume.
These suggest emerging markets for traders to identify potential opportunities with high growth potential.
Get UPay Crypto Card
Experience the Best of Online Payment and Seamless Crypto Transactions.
Sign Up
Trading Volume of Top Cryptocurrencies in 2024
Some of the big players in the crypto market have racked up encouraging numbers recently.
Bitcoin continues to dominate the cryptocurrency market, with its
daily trading volume exceeding $100 billion in early 2024. This
significant trading volume underscores Bitcoin's liquidity and stability
as a leading digital asset.
For traders, this high volume means reduced slippage and easier entry
and exit from positions. Investors can view Bitcoin's sustained high
trading activity as a marker of its enduring market confidence and
relevance.
Ethereum, the second-largest cryptocurrency by market capitalization,
has seen its 24-hour trading volume reach $40 billion. This robust
trading activity highlights Ethereum's critical role in decentralized
finance (DeFi) and smart contracts.
For traders and investors, this statistic indicates Ethereum's strong
market presence and the high level of interest in its technological
advancements and ecosystem growth.
As the leading stablecoin, Tether (USDT) has achieved a daily trading
volume of $75 billion. This substantial volume demonstrates Tether's
pivotal role in providing liquidity and stability within the volatile
crypto market.
For crypto enthusiasts, understanding Tether's volume can offer
insights into market liquidity and sentiment, as well as its use in
facilitating trades across various exchanges.
Binance Coin's (BNB) 24-Hour Trading Volume Climbs to $10 Billion
Binance Coin (BNB), the native token of the Binance exchange, has
seen its 24-hour trading volume rise to $10 billion. This statistic
reflects the token's extensive use in trading fee discounts and its
growing utility within the Binance ecosystem.
For traders, high BNB volume suggests strong user engagement with the
Binance platform, making it a critical metric for evaluating exchange
activity and token utility.
Solana's (SOL) Daily Trading Volume Peaks at $5 Billion
Solana (SOL), known for its high-speed blockchain, has reached a
daily trading volume of $5 billion. This significant volume showcases
Solana's increasing adoption and its role in supporting various DeFi and
NFT projects.
For investors, Solana's trading volume is a key indicator of its
market momentum and the growing interest in its scalable blockchain
solutions.
Dogecoin (DOGE), initially created as a meme coin, has seen its
24-hour trading volume hit $3 billion. This high volume highlights the
coin's widespread popularity and speculative trading activity.
For crypto traders, DOGE's volume can signal market trends and
sentiment, providing opportunities for profit from its volatility and
large community-driven movements.
Ripple (XRP) has maintained a daily trading volume of $4 billion,
reflecting its strong market presence despite regulatory challenges.
XRP's trading volume is crucial for traders and investors, as it
indicates liquidity and the ongoing interest in Ripple's cross-border
payment solutions.
This statistic can help assess the resilience and potential growth of XRP in the evolving crypto landscape.
Get UPay Crypto Card
Experience the Best of Online Payment and Seamless Crypto Transactions.
Sign Up
Other General Crypto Trading Volume Statistics
Global Stablecoin Market Capitalization
In 2024, the market capitalization of stablecoins surpassed $150
billion. This growth underscores the increasing reliance on stablecoins
for transactions and as a store of value within the crypto ecosystem.
Stablecoins provide a hedge against volatility, making them crucial
for traders and investors seeking stability in a fluctuating market.
Decentralized Exchange (DEX) Trading Volume
The daily trading volume on decentralized exchanges (DEXs) hit $10 billion in 2024.
This significant volume highlights the growing trust and adoption of
DEXs, which offer enhanced security and privacy over traditional
centralized exchanges.
The rise of DEXs is driven by the demand for decentralized financial solutions and the increasing number of DeFi projects.
Crypto Futures Market Growth
In 2024, the global cryptocurrency futures market's trading volume
surged to $2 trillion monthly. This growth indicates the rising
popularity of derivative products among investors looking to hedge
positions or speculate on future price movements.
The futures market provides additional liquidity and allows for more
sophisticated trading strategies, enhancing the overall robustness of
the crypto market.
NFT Market Trading Volume
The trading volume for non-fungible tokens (NFTs) reached $50 billion
in 2024. This explosion in volume signifies the booming interest in
digital collectibles, art, and other unique digital assets.
NFTs have opened up new revenue streams for creators and attracted a
wide range of investors, showcasing the versatility and expanding use
cases of blockchain technology.
Institutional Trading Volume Increase
Institutional investors significantly increased their participation
in the crypto market, with their trading volume rising to $500 billion
in 2024. This increase reflects the growing acceptance of
cryptocurrencies as a legitimate asset class and the entry of
traditional financial institutions into the market. Institutional
involvement brings more stability and liquidity, encouraging further
market maturity.
Growth in Crypto Payment Volume
In 2024, the volume of cryptocurrency payments exceeded $100 billion
annually. This statistic illustrates the growing adoption of
cryptocurrencies for everyday transactions, including e-commerce and
remittances. The increasing use of crypto for payments is driven by
lower transaction fees, faster processing times, and the global nature
of digital currencies.
Get UPay Crypto Card
Experience the Best of Online Payment and Seamless Crypto Transactions.
Sign Up
Trading Volume Demographics Statistics
Youth Dominance in Crypto Trading
A survey in 2024 found that 60% of crypto traders are between the
ages of 18 and 34. This demographic skew towards younger investors
highlights their openness to new technologies and higher risk tolerance.
Young traders are often more tech-savvy and eager to explore the
potential high returns that the volatile crypto market can offer.
Gender Distribution in Crypto Trading
In 2024, women made up 25% of cryptocurrency traders. Although men
still dominate the trading demographic, the percentage of women
participating in the market is growing.
Increased educational resources and community support are helping
bridge the gender gap, encouraging more women to invest and trade in
cryptocurrencies.
Regional Trading Volume Distribution
Asia remains the leading region in cryptocurrency trading, accounting
for 40% of the global trading volume in 2024. North America follows
with 30%, and Europe contributes 20%.
The dominance of Asia is attributed to high technology adoption
rates, favorable regulations, and a strong culture of innovation in
digital finance.
Income Level of Crypto Traders
A study in 2024 revealed that 35% of cryptocurrency traders have an annual income of over $100,000.
Higher-income individuals are increasingly viewing cryptocurrencies
as a viable investment option, attracted by the potential for
significant returns and the ability to diversify their investment
portfolios beyond traditional assets.
Education Level Among Crypto Traders
In 2024, 70% of crypto traders held at least a bachelor's degree.
This statistic suggests that higher education levels correlate with
greater involvement in cryptocurrency trading.
The technical nature of cryptocurrencies and blockchain technology
likely attracts individuals with a solid educational background and a
strong understanding of finance and technology.
Conclusion
The cryptocurrency market is gaining popularity every day, with
remarkable growth evident in increasing market capitalizations and
trading volumes.
Bitcoin and Ethereum continue to lead the charge, while altcoins and DeFi projects present new opportunities for investors.
The surge in institutional involvement and the different trading
demographics further confirm the adoption of cryptocurrencies. However,
despite thousands of people earning significant profits, many aspects of
it remain unclear.
The
cryptocurrency market's trading volume has hit unprecedented levels,
particularly for centralized exchanges (CEXs). What has caused this
boom? A combination of factors contributed to the notable increase in
trading volume for the top ten centralized exchanges. They collectively
saw a staggering 111.7% rise in their overall trading volume in the last
quarter of 2024, amounting to $6.4 trillion. This upturn follows a
period of market consolidation. A robust recovery in the crypto market,
increased institutional participation, technological advancements, and
growing retail acceptance have all played significant roles in this
surge.
Which exchanges are seeing the most success?
Several
exchanges are posting substantial gains. Eight of the top ten exchanges
reported over a 100% increase in their trading volume, with Upbit
leading the pack with over 300% growth. Coinbase and Crypto.com also shone brightly, each with more than 150% growth, while others like Gate.io and MEXC followed closely behind, each surpassing the 120% mark.
How is Binance keeping its edge?
Despite
facing increasing competition, Binance remains the largest player in
the CEX space for both spot and decentralized trading. In December 2024
alone, Binance registered $1 trillion in total spot trading volume,
securing a 34.7% market share—though it’s worth noting that this figure
has declined throughout the year from 44.1%.
What are Binance's strategies to retain its position?
To
maintain its leading position, Binance employs a multifaceted approach.
It diversifies its range of services to attract a broader audience,
continually innovates its platform, and leverages its extensive global
presence.
How are geopolitical events influencing trading volumes?
Geopolitical
events are often catalysts for increased trading volumes. The ongoing
Russia-Ukraine conflict exemplifies this, with the crypto market
experiencing heightened trading activity as investors seek refuge from
traditional fiat currencies. Following the invasion, the trading volume of the Russian Ruble on crypto exchanges surged by 260%, and Bitcoin prices experienced significant volatility.
Why are DeFi platforms a challenge for CEXs?
Decentralized
finance (DeFi) platforms are becoming formidable competitors to
centralized exchanges. Their decentralized nature, enhanced privacy,
reduced fees, and transparency attract traders who prefer a different
approach to trading. CEXs are countering this by integrating DeFi
features and adopting hybrid models.
What risks are associated with increased trading volumes?
While
increased trading volumes can indicate market activity, they also
introduce risks. High trading volumes do not eliminate the volatility
and leverage risks inherent in crypto markets, which can worsen price
drops. Additionally, the lack of regulatory oversight and transparency
can obscure risks, and structural flaws in blockchain networks can
result from congestion.
How can fintech startups capitalize on rising trading volumes?
Fintech
startups can seize the opportunities arising from the rise in trading
volumes by establishing relationships with liquidity providers, offering
competitive fees, expanding trading options, implementing advanced
trading tools, utilizing trading bots, and adhering to global standards.
Collaborating with major tech companies and other fintech firms can
enhance their competitiveness and innovation in the crypto trading
space.
Crypto
trading volume is a vital metric for understanding the dynamics of the
cryptocurrency market. It represents the total quantity of a
cryptocurrency traded within a specific timeframe and is an essential
indicator for traders and investors. This blog post explores what
trading volume is, why it matters, and how it can inform trading
strategies. By understanding the nuances of volume analysis, traders can
better assess market trends, liquidity, and potential price movements.
We will also look at some practical ways to incorporate trading volume
into your analysis toolkit.
What Is Crypto Trading Volume?
Crypto
trading volume refers to the total number of coins or tokens exchanged
between buyers and sellers within a specified period, such as a day,
week, or month. This metric is commonly expressed as the total monetary
value of these trades or as the number of units traded. Higher trading
volumes often indicate heightened market activity, while lower volumes
may signal reduced interest or liquidity. For traders, understanding
trading volume is crucial because it serves as a proxy for market
participation and investor sentiment. Whether you are trading a
well-established coin or a newly launched token, volume is a key factor
to watch.
The
significance of trading volume lies in the insights it provides about
market behaviour. For instance, rising volume often accompanies
significant price movements, suggesting stronger conviction among market
participants. On the other hand, low volume during a price increase or
decrease could indicate a lack of broader market support. Traders use
these patterns to make decisions about entry and exit points in the
market. Understanding the context behind trading volume can therefore be
a powerful tool in a trader’s arsenal.
Why Trading Volume Matters in Cryptocurrency
Trading
volume plays a pivotal role in determining the health and viability of a
cryptocurrency. Higher volumes generally suggest that a cryptocurrency
is actively traded and has sufficient liquidity to facilitate
transactions. Liquidity is essential for traders, as it reduces
slippage, ensuring that buy and sell orders are executed at favourable
prices. Moreover, high trading volumes indicate that a cryptocurrency is
attracting significant interest from the market, which can boost its
credibility and perceived value.
For
long-term investors, trading volume is equally important. Sustained
high volumes over time indicate that a cryptocurrency is not just a
passing trend but has staying power in the market. Conversely,
cryptocurrencies with consistently low trading volumes may face
challenges in gaining widespread adoption or maintaining investor
confidence. Additionally, trading volume can be used to confirm trends,
as price movements accompanied by high volume are generally considered
more reliable. By analysing trading volume, both short-term traders and
long-term investors can gain a clearer picture of a cryptocurrency’s
market dynamics.
It’s
also important to note that trading volume can serve as an early
warning system for market anomalies. Sudden spikes in volume may
indicate the entry of large players or unexpected news affecting the
cryptocurrency. On the other hand, sharp declines in volume could
signify waning interest or the exit of significant market participants.
Being attuned to changes in volume can help traders adjust their
strategies to better navigate the market.
How to Analyse Crypto Trading Volume
To
make the most of trading volume, it’s essential to understand how to
analyse this metric effectively. Volume analysis often involves
comparing current trading volumes to historical averages to identify
trends or anomalies. A higher-than-usual trading volume could indicate
strong market activity, which might signal the beginning of a new trend.
Conversely, low trading volume during price movements could suggest
that the trend lacks support and might reverse.
Volume
is often combined with other indicators, such as price action, to form a
more comprehensive market analysis. For example, a price increase
accompanied by rising volume is generally considered bullish, while a
price drop with increasing volume is seen as bearish. Traders also look
for divergences, where volume trends contradict price movements, as
these can indicate potential reversals. Understanding these nuances can
give traders an edge in identifying opportunities and risks.
In
addition to standalone analysis, many traders use tools like volume
profiles and volume-weighted indicators. These tools help to pinpoint
areas of strong buying or selling interest, providing additional context
for price action. By incorporating volume analysis into their broader
trading strategy, traders can improve their ability to predict and react
to market movements. Understanding trading volume is not just about
tracking numbers but interpreting what those numbers mean in the context
of market psychology.
Practical Tips for Using Trading Volume
Trading
volume is a powerful tool, but it must be used wisely to maximise its
benefits. One practical tip is to focus on significant volume changes
rather than minor fluctuations. A sudden increase in volume could signal
an opportunity, but it’s essential to pair this observation with other
market indicators to confirm your hypothesis. Another approach is to
monitor volume trends over different timeframes to get a clearer picture
of market behaviour.
Using
trading volume as a standalone metric can sometimes be misleading. For
instance, a coin with artificially inflated volume may appear more
active than it actually is, leading to false conclusions. This is why
it’s crucial to verify volume data from multiple reliable sources.
Additionally, understanding the context behind volume spikes—such as
news events, partnerships, or listings—is essential for making informed
decisions. Volume analysis should always be part of a broader,
well-rounded trading strategy.
Crypto
price charts are an essential tool for understanding and analysing the cryptocurrency market. They provide a visual representation of price
movements over time, helping traders and investors make informed
decisions. This blog post explores the components, types, and
significance of crypto price charts while offering insights into how to
interpret them effectively. By understanding these charts, readers can
gain a deeper grasp of market trends and better navigate the volatile
world of cryptocurrencies. Whether you're a beginner or an experienced
trader, this guide aims to equip you with the knowledge to use crypto price charts effectively.
Introduction to Crypto Price Charts
Crypto
price charts are a fundamental part of analysing the cryptocurrency
market. They display the price history of digital assets, helping
traders understand how a specific cryptocurrency has performed over
time. These charts are used to track trends, predict future movements,
and assess market sentiment. By studying price charts, traders and
investors can identify patterns that indicate potential buying or
selling opportunities. Understanding the basics of these charts is
essential for anyone seeking to navigate the dynamic world of
cryptocurrencies effectively.
Crypto
price charts are not only for professionals; even beginners can benefit
from learning how to read and interpret them. They provide a simple way
to grasp market dynamics, offering a clearer picture of price
fluctuations. For instance, patterns like uptrends, downtrends, and
sideways trends become apparent when studying these charts. Furthermore,
the use of technical indicators, such as moving averages or volume
data, enhances the depth of analysis. Whether you're looking to make
short-term trades or long-term investments, crypto price charts are a
valuable tool for success.
Key Components of Crypto Price Charts
Every
crypto price chart consists of essential elements that convey valuable
information. The x-axis typically represents time, showing intervals
ranging from minutes to years, while the y-axis represents price,
allowing users to track how a cryptocurrency's value has changed. The
chart itself may take various forms, such as line charts, bar charts, or
candlestick charts. Each format has its own advantages and
applications, depending on the trader's preference and analytical
approach.
In
addition to the basic structure, crypto price charts often feature
volume indicators, showing the amount of trading activity over a
specific period. Volume data can help traders understand the strength of
price movements and identify potential reversals. Many charts also
include overlays or indicators like moving averages, Bollinger Bands,
and Relative Strength Index (RSI). These tools provide deeper insights
into trends, momentum, and potential price changes. Understanding these
components is crucial for interpreting crypto price charts effectively.
Types of Crypto Price Charts
There
are several types of crypto price charts, each with unique
characteristics and applications. Line charts are the simplest and most
commonly used by beginners. They connect closing prices over a specified
time period, offering a clean and straightforward view of price trends.
While they lack detail, line charts are effective for identifying
general trends and patterns.
Bar
charts and candlestick charts are more detailed and widely used by
experienced traders. A bar chart shows the opening, closing, high, and
low prices for each time period. Similarly, candlestick charts display
the same data but in a more visually intuitive format. Candlesticks use
colours to indicate whether the price has risen or fallen, making it
easier to interpret market sentiment. These charts are particularly
useful for identifying specific patterns, such as "hammer" or "doji"
formations, which can signal potential reversals.
The
choice of chart depends on the trader's skill level and the type of
analysis they wish to perform. While beginners might start with line
charts, advanced traders often prefer candlestick charts for their depth
of information. Understanding the strengths and weaknesses of each type
is key to selecting the most appropriate chart for your needs.
Importance of Crypto Price Charts for Traders
Crypto
price charts are indispensable tools for traders seeking to make
informed decisions in a volatile market. They provide a clear view of
historical price movements, helping traders predict future trends based
on past behaviour. This ability to anticipate market direction is
particularly valuable in a fast-moving environment like cryptocurrency
trading.
Moreover,
price charts enable traders to identify key levels of support and
resistance. Support levels are points where a cryptocurrency's price
tends to stop falling and may reverse upwards, while resistance levels
indicate where prices often stop rising. Understanding these levels can
help traders set entry and exit points effectively.
The
use of price charts also promotes disciplined trading by providing
objective data. Instead of relying on emotions or gut feelings, traders
can base their decisions on technical analysis. This approach reduces
the risk of impulsive trades and improves the likelihood of long-term
success. Whether you’re day trading or holding assets for the long term,
crypto price charts are essential for navigating the market.
Conclusion
Crypto
price charts are a cornerstone of successful trading and investing in
the cryptocurrency market. They offer valuable insights into price
trends, market sentiment, and trading opportunities. By understanding
the different types of charts, key components, and common mistakes to
avoid, traders can make better-informed decisions and increase their
chances of success. Whether you’re a novice or an experienced trader,
mastering the art of reading crypto price charts is an essential step
towards achieving your financial goals in the world of cryptocurrency.
Timing the Market vs. Time in the Market - Crypto Investing Strategies
Key Points
Timing
the market is a crypto investing strategy which involves making buying
or selling decisions by attempting to predict the future market price
movements of an asset - buying low and selling high.
Time
in the market refers to a passive investment strategy in which an
investor holds a position for an extended period (usually a few years or
more).
Both
investing strategies come with different trade-offs for different
investors. More experienced crypto investors with a deep understanding
of market dynamics may be in a better position to time the market with
some consistency.
But
for the average or beginner investor, trying to time the market is more
akin to a game of luck, and the odds aren’t in your favour. Most
investors are better suited to long-term strategies (e.g. buying and
holding).
“Far more money has been lost by investors trying to anticipate corrections, than lost in the corrections themselves.” -Peter Lynch, investor, mutual fund manager, and philanthropist
Even the greatest investors of our era willingly admit that timing the market is notoriously difficult to pull off.
While success stories are often shared of the few who timed it right, these stories are few and far between. And the stories of them doing it more than once are even rarer. A study on day traders found that over 70% of investors lose money in their first year of implementing market timing.
On the other hand, time in the market is an approach that carries less risk if done correctly. But it can test the patience of an investor, who may not see a significant profit for years.
Which one is better? Let’s explore the risks and rewards of each.
What is Market Timing?
Market timing is a strategy in which investors forecast market movements over a period of time. Using these predictions investors make certain, calculated entries into the market in an attempt to make a short-term profit, or avoid potential losses.
This strategy relies on an investor's ability to consistently predict market dips and peaks, and use that information to enter and exit the market at the most opportune times. Market timing is often used by day traders.
Being able to forecast the market is a skill that doesn’t form overnight. Even the most experienced investors can’t account for unpredictable circumstances that could negatively impact their strategies. Investors who time the market are regularly assessing where the market is going; tuning into trends and news that could impact the trajectory of their investments. Investors using this method usually have a good understanding of technical analysis and can use their knowledge and experience to make informed decisions.
An Example of Timing the Market
The price XRP is $0.75. An investor believes that the price will rise to $1 within the next few days due to a major event and purchases $750 of XRP (1000 XRP). A few days later the price rises to $1. The investor sells their 1000 XRP and profits $250.
Every investment carries some level of risk. The investor in the example above could have purchased more XRP, earning even more profits. But if the market turned over those few days, their losses would be equally as large.
Timing the market seeks to maximise profits. With higher reward potential, higher risk follows.
What is Time in the Market?
This strategy is a passive, long-term approach to investing in crypto. It requires patience, leaving assets untouched for up to years at a time (or until they realise their future potential).
In this method, investors generally buy an asset and hold it until it reaches a predetermined price target. Rather than trying to time when an asset’s price will rise, investors select an asset/project they believe will achieve long-term success and hold onto that asset regardless of market status or sentiment. When the price is right for them, they exit the market with a reasonable profit.
Although this conservative style of investing could carry lower risk than market timing, it is not completely risk-free. If the asset price falls to zero, it doesn’t matter what price you entered the market at. Your investment is a net loss.
An Example of Time in the Market
A real-life example of this strategy was used by Erick Finman. In 2011, at only age 12, he invested $1000 (gifted to him by his grandmother) into Bitcoin when the price was just $12. When the value of Bitcoin rose to $1200 in 2013, his initial investment increased by 9900%. He continued to hold on to a portion of his Bitcoin investment, eventually becoming a millionaire by age 18.
Dollar Cost Averaging
A strategy often used in conjunction with time in the market is dollar cost averaging (DCA). In addition to holding an asset for a longer period, investors also continue to invest fixed amounts of money into a crypto asset at regular time intervals (e.g. weekly, fortnightly, monthly). The investment is made regardless of the asset's price at the time of investing.
Rather than investing a large sum and being locked into a certain entry price, investors using DCA absorb some market volatility in order to make the most of peaks and dips.
When the market falls, DCA investors shoulder the impact by buying more shares at a lower price. When the market rises, these same investors end up buying fewer shares at a fixed price, yet they profit off of the previous shares they purchased. The result is a portfolio that is somewhat reflective of the price history of the asset during the investing period.
Timing the Market vs. Time in the Market
While they may sound the same, timing the market and time in the market are two distinct investing styles.
Timing the market is a proactive approach, where investors or traders need to be tuned into the market daily in order to determine an ideal time to buy or sell.
Time in the market is much more passive. This approach centres around the asset itself, financial research and whether it has strong fundamentals that will contribute to an increase in value in the future.
Overall, time in the market is often considered a stronger investment strategy for the average investor, especially those who don’t have much experience in crypto markets. It takes a tremendous amount of discipline and time to have a small chance of being successful at timing the market. Even experienced traders often have difficulty timing the market consistently.
Time in the market is less risky and more likely to deliver positive results consistently, but it can take a very long time to be profitable.
Hybrid Investing Strategies
Some investors choose to combine both of these methods, effectively creating a mid-term strategy over the course of a market cycle.
An investor who can effectively read and analyse market trends may purchase an asset when the price is low. Instead of trading immediately for a small profit, they’ll hold onto the investment until the price rises further down the market cycle. This combined strategy could play out over the course of a few months or a year.
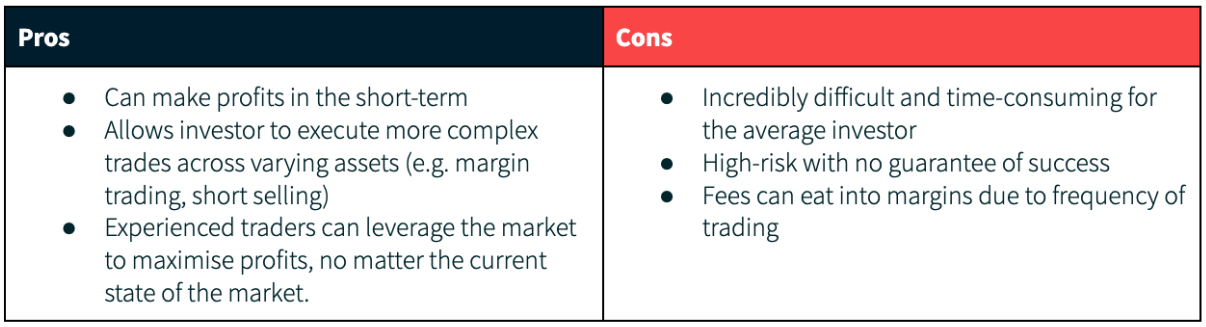
Pros & Cons of Timing the Market
Timing the Crypto Market
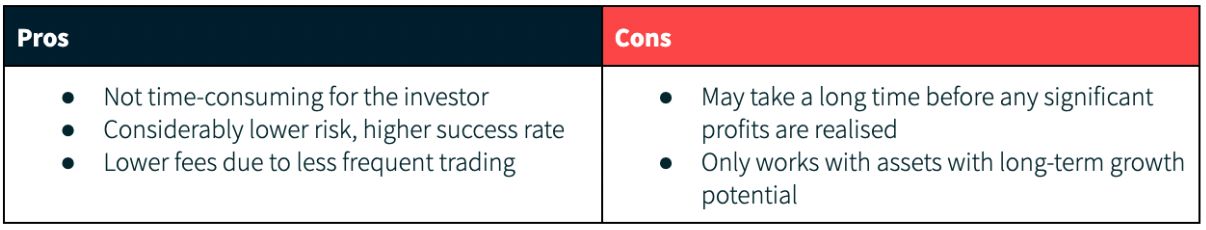
Pros & Cons of Time in the Market
Time in the Crypto Market
Things to Consider
When trying either of these strategies it’s important to consider the following:
Evaluate Your Portfolio Regularly
Keeping tabs on your portfolio is absolutely essential when timing the market, as it could be a good indicator of whether your strategy is working. While this is less important for those who choose to hold their investments, a periodic check-in (quarterly, semi-annual, or at your own discretion) could help investors assess whether an asset is on track to meet its long-term goals.
Be Wary of Fees
Depending on the trading platform you use, there may be various fees associated with each trade, deposit, and withdrawal. If you are trading frequently, make sure to factor in these fees as they could negatively affect your profits over time. At Caleb & Brown we have zero fees on deposits and withdrawals, and offer one transparent, flat fee on every trade, making it ideal for passive and active investors alike.
No Strategy is Completely Risk-Free
As with any investment, there is no zero-risk method. Both of these strategies incur various levels of risk. Even the most experienced investors can’t negate unpredictable events that would impact their strategy. Doing your own research (DYOR) should precede any investment. Lastly, only invest what you can afford to lose.
Summary
For many investors, time in the market beats timing the market.
Timing the market consistently is incredibly difficult and it also takes a tremendous amount of energy and discipline. Whereas, time in the market requires less effort and produces more consistent outcomes.
Whatever investment style you choose, it is important to conduct thorough research. Otherwise, it is no different from gambling.


.jpg)


.jpg)

